# Observability with MLflow
> Integrate goose with MLflow to observe and evaluate agent performance
- 网址:https://funcoding.ai/agents/goose/tutorials/mlflow/
- 来源:goose 官方文档原文(英文),Apache-2.0 许可,同步于 2026-10-11
- 官方原文:https://goose-docs.ai/docs/tutorials/mlflow
---
This tutorial covers how to integrate goose with MLflow to trace your goose sessions and understand how the agent is performing.
## What is MLflow
[MLflow](https://mlflow.org/) is an [open-source](https://github.com/mlflow/mlflow) platform for managing the end-to-end machine learning and AI lifecycle. MLflow Tracing provides detailed observability into AI agent execution, capturing LLM calls, tool usage, and agent decisions with a rich visualization UI.
## Why MLflow for goose
- **Detailed trace visualization**: Inspect every LLM call, tool execution, and agent decision in a hierarchical trace view.
- **Token usage tracking**: Monitor input/output token counts and costs across sessions.
- **Evaluation framework**: Evaluate agent outputs using built-in LLM judges and custom scorers.
- **Prompt management**: Version and manage prompts used across your AI applications.
- **Open source**: Fully open-source with no vendor lock-in, self-host anywhere.
## Set up MLflow
Install MLflow and start the tracking server:
```bash
pip install mlflow
mlflow server --port 5000
```
The MLflow UI will be available at `http://localhost:5000`.
For production use, configure a SQL backend store (PostgreSQL, MySQL) instead of the default SQLite. See the [MLflow documentation](https://mlflow.org/docs/latest/self-hosting/architecture/backend-store.html) for details.
## Configure goose to export OTLP to MLflow
goose exports OpenTelemetry data over OTLP/HTTP. Point the exporter to MLflow's OTLP endpoint:
```bash
export OTEL_EXPORTER_OTLP_ENDPOINT="http://localhost:5000"
export OTEL_EXPORTER_OTLP_HEADERS="x-mlflow-experiment-id=0"
```
The `x-mlflow-experiment-id` header specifies which MLflow experiment to log traces to. Use `0` for the default experiment, or create a dedicated experiment:
```bash
pip install mlflow
mlflow experiments create --experiment-name "goose-traces"
# Use the returned experiment ID in the header
```
To export only traces (disable metrics and logs export):
```bash
export OTEL_TRACES_EXPORTER=otlp
export OTEL_METRICS_EXPORTER=none
export OTEL_LOGS_EXPORTER=none
```
To include model messages and tool arguments/results in traces, explicitly enable
GenAI message content capture:
```bash
export OTEL_INSTRUMENTATION_GENAI_CAPTURE_MESSAGE_CONTENT=true
```
Message content can contain sensitive data and produce large traces. Leave this
setting disabled unless your telemetry storage is appropriate for that data.
## Run goose with MLflow enabled
Start goose normally. With the OTLP environment variables set, goose will automatically export traces to MLflow:
```bash
goose session
```
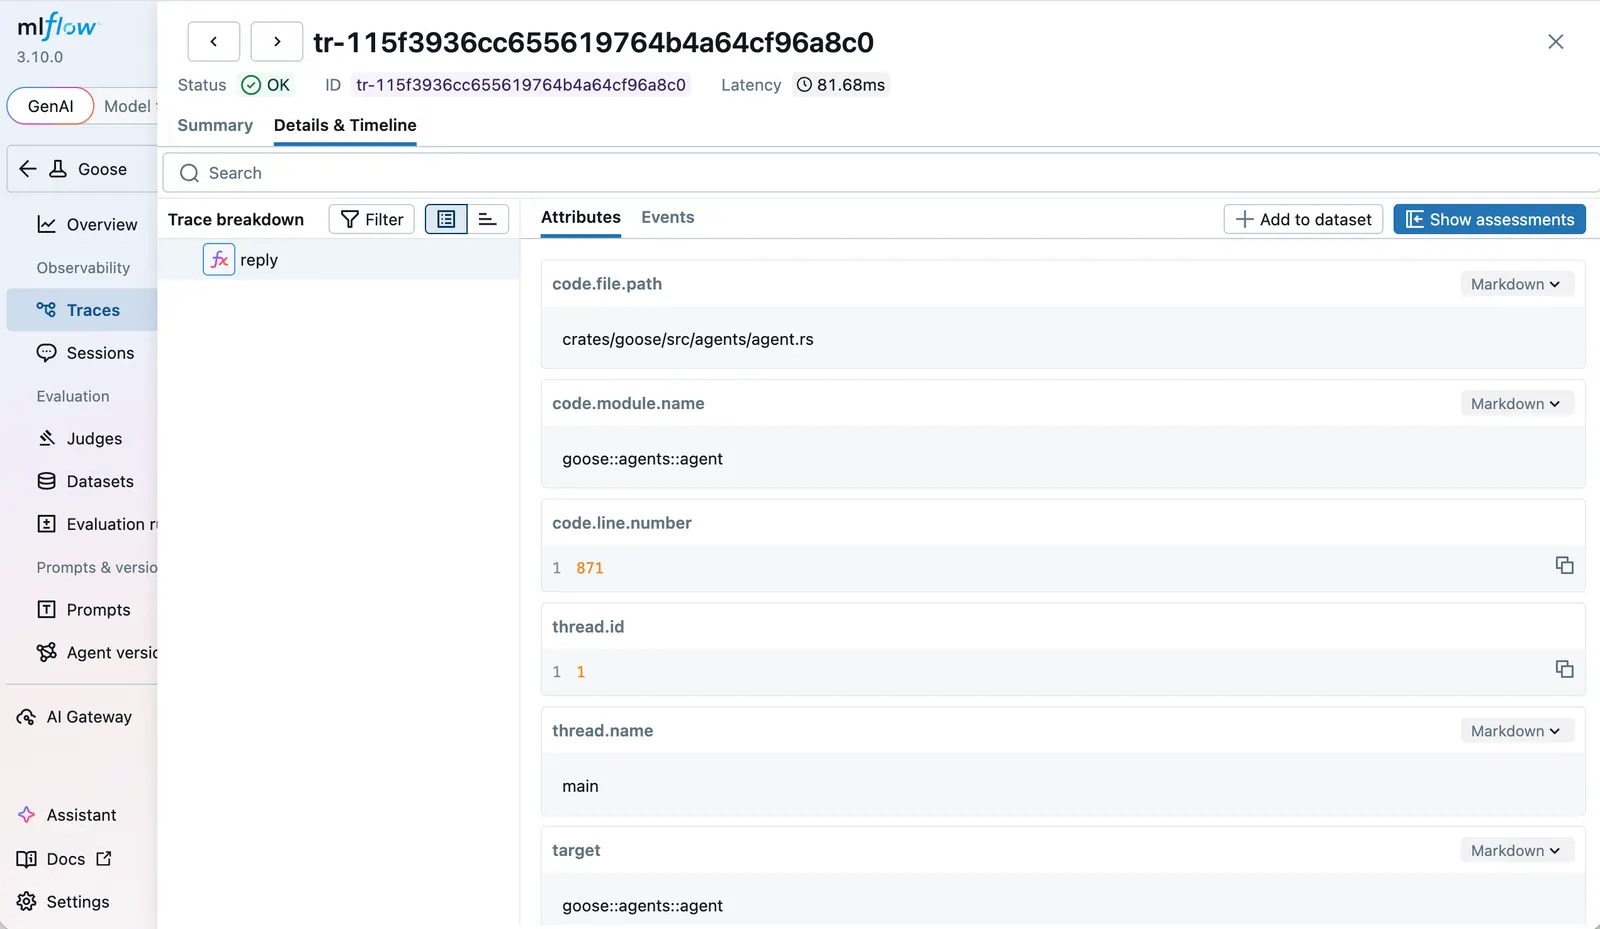
Open the MLflow UI at `http://localhost:5000` and navigate to the **Traces** tab to see detailed traces of your goose session, including LLM calls, tool executions, and token usage.
## Learn more
- [MLflow Tracing documentation](https://mlflow.org/docs/latest/genai/tracing/)
- [MLflow OpenTelemetry integration](https://mlflow.org/docs/latest/genai/tracing/app-instrumentation/opentelemetry.html)
- [MLflow goose integration guide](https://mlflow.org/docs/latest/genai/tracing/integrations/listing/goose.html)